


TOP 10 tips to save fuel. We’ve all read lists like that during the past few years as the cost of fuel continues to lighten our wallets irrespective of what we drive. And, buried in that list, is the inevitable sentence or two recommending the removal of all ex-factory addenda when they’re not in use. This is logical – increased drag would mean greater fuel consumption – but those lists never actually quantify how much extra fuel you’d be burning.
Therefore we decided to put it to the test. We transported two bicycles at a speed of 120 km/h and worked out both the extra energy needed to overcome this added aerodynamic drag and what the resultant fuel consumption penalty would be. For a better general understanding of how aerodynamics work, have a look at the Cheating The Wind feature that appeared in the September 2014 issue.
THE EQUIPMENT
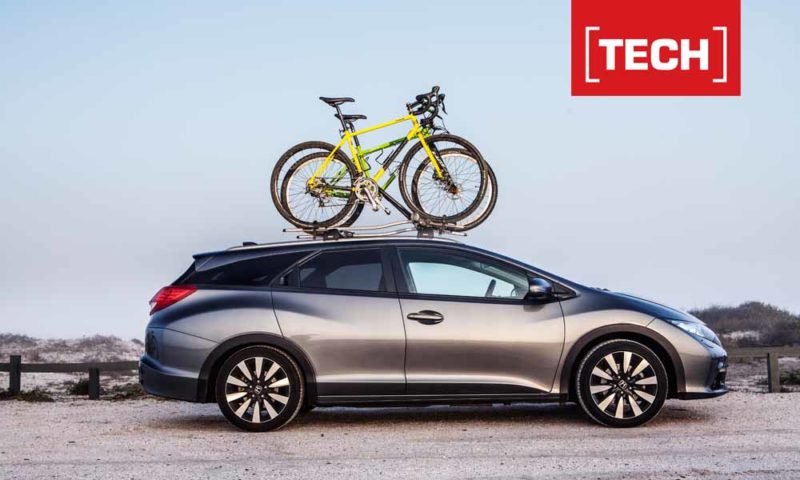
The car As it was already fitted with a towbar and Thule wing bars (roof racks), the Honda Civic Tourer long-term test vehicle was the ideal subject. By virtue of the Tourer’s station-wagon body and the fact that its second row of seats can fold completely flat (through Honda’s “magic seat” system), we could fit the bikes and equipment inside the vehicle for part of the test.
The carrier system Thule provided us with two ProRide bicycle carriers for the roof, as well as a Euroway two-bike carrier that mounts on a vehicle’s towbar.
The measuring equipment It was the same hardware we use for CAR’s routine road test performance testing, namely the GPS-based Racelogic Vbox system.
TEST CONFIGURATIONS
We transported the bicycles in three different configurations to assess aerodynamic penalty comparison:
Configuration 1
Bikes inside: all of the equipment, including the two bicycles, was loaded inside the Honda to keep the mass of the vehicle constant. This configuration would represent the standard airflow over the Civic Tourer when it is in motion.
Configuration 2
Bikes on towbar-mounted carrier: the roof racks were removed, so that only the bikes and carrier at the back of the vehicle would affect the airflow. Although the bikes were at 90° to the direction of travel, only a small part of the wheels were subjected to the direct air stream as the bicycles’ frames were partly “hidden” in the low-pressure region behind the vehicle.
Configuration 3
Bikes on roof: the bikes were facing forward, but subjected to the full airflow over the roof of the Honda. In this configuration we also loaded the towbar carrier inside the vehicle.
THE TESTS
Coast-down testing
When a vehicle is travelling in a straight line on a level road and allowed to coast to a standstill with its transmission in neutral, the forces opposing motion are mostly aerodynamic-, rolling resistance-, and friction-related. The idea was to get a baseline test with configuration 1 and compare the speed and distance readings to those of configurations 2 and 3. Any additional aerodynamic drag tends to slow down the vehicle faster and we calculated the extra force using Newton’s second law of motion.
As aerodynamic forces rise with the square of a vehicle’s speed, we decided to focus on the high-speed region (motorway driving) as this should best demonstrate deviation between the configurations. Coast-down testing therefore commenced at 140 km/h and the Civic Tourer was allowed to coast until the vehicle speed reached 50 km/h.
From the coast-down testing results depicted in the graph (top right), you can clearly see that the extra drag created by the factors in configurations 2 and 3 results in a steeper drop-off in vehicle speed over distance. The calculated total resistance force from the coast-down testing is shown for each configuration in the graph (above right). Note the exponential nature of the aerodynamic drag force component with the rise in vehicle speed.
Fuel consumption testing
To compare the Civic Tourer’s indicated fuel consumption for all three bicycle transport configurations, we drove the vehicle along a 50 km route (2 x 25 km, ending at the start location) three times at a true 120 km/h.
The fuel-consumption testing correlated well when the percentage power increase needed to overcome the total resistance force (from coast-down testing) is compared with the percentage of additional fuel used for configurations 2 and 3. This makes sense because fuel is the vehicle’s only propulsion energy source when cruising on a level road (ignoring wind, etc.)
WHAT IT MEANS IN RANDS AND CENTS…
For every 100 km travelled at 120 km/h with the bikes on the roof, a Civic Tourer’s owner will have to spend an extra R30,73 on fuel. On a 1 000 km road trip, this will equate to R307,30 in additional fuel expense. It is important to note that travelling at a lower speed will dramatically reduce the drag force and fuel consumption penalty for configurations 2 and 3.
SUMMARY
Our investigation proved that any object affecting airflow over your vehicle carries a fuel penalty. Just how much that equated to in monetary terms was, however, more of a surprise.
From a theoretical point of view, the separate tubes forming the frame, as well as the handlebars and the spoked wheels, mean a bicycle has one of the worst drag coefficients that your vehicle could be burdened with. However, you also have to take into account the convenience of hauling your bicycles when they’re attached to the outside your vehicle.
The take-out from the test, therefore, is that if you transport bicycles on the outside your vehicle, then rather mount them at the rear – it will lessen the fuel-consumption penalty. If you don’t, your biking hobby may cost you a lot more than the purchase price of those bikes!
Description of calculations
Newton’s second law of motion states that the total force acting on a body is equal to the mass of the body times its acceleration (F = ma). With the coast-down testing, we have the vehicle’s mass and the change in the vehicle’s speed over time and can therefore calculate the deceleration at 120 km/h.
This means we calculate the total resistance force by substituting the values in the equation (F = ma) at that instant. For a vehicle to cruise at 120 km/h, the powertrain will have to supply a force pushing the vehicle forward equal to the total resistance force. The power consumption (in Watts) is calculated by multiplying the total resistance force (N) with the vehicle speed (m/s).